What do we do in the Satellite Remote Sensing team?

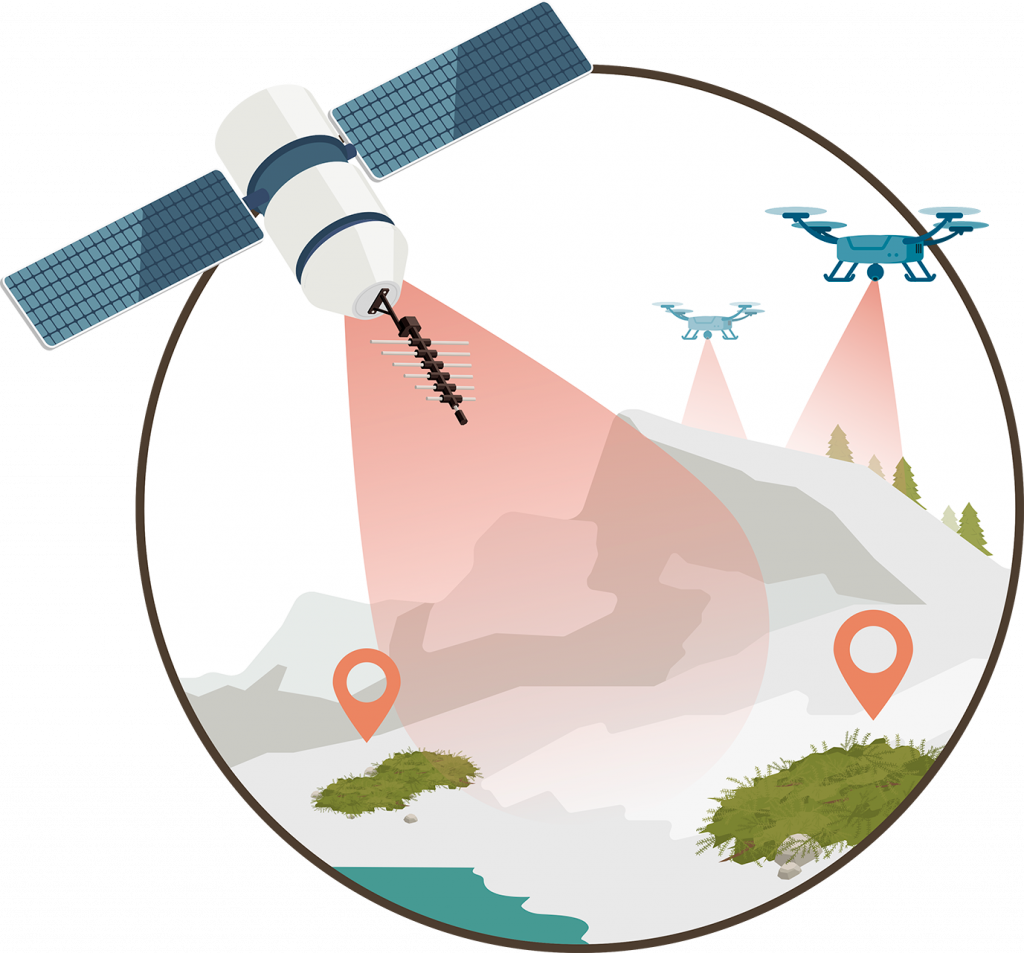
We study the natural environment using satellite images taken from space.

Using remote sensing we improve our knowledge on ecology, and on the management and conservation of biodiversity. We use time series of satellite images of Sierra Nevada to pursue the goals of our team.

Our group collaborates with other teams in the Smart Ecomountains framework to pursue common goals.

Learn more about how we use remote sensing!

Our goals are listed below:

Learn more about how we use remote sensing!

Our goals are listed below:

Descubre como la salud de los ríos empeora debido a la actividad humana.

Desde su nacimiento en la cabecera de los valles glaciares de Sierra Nevada, el estado de los ríos empeora debido a la actividad humana.

Rotate

What have we achieved?

Thanks to remote sensing we may study the natural environment anywhere in the world and by automated means.

The use of remote sensing has enabled us to collect data more easily, considering that sampling in several places is impossible, difficult, or very expensive from an economic point of view. Besides, it has enabled us to study large areas and long time periods. In this way, we have managed to make data collection automatic, and this helps us perform a more thorough follow-up of our surroundings.

  1. MonitorEO
    We developed a tracking system for key aspects in the functioning of ecosystems, and this allows us to detect trends, abrupt changes and disturbances in a way that is fast, reliable, and applicable to any region. Several variables are involved, including how long the snow cover remains, the vegetation greenness, or water and heat stress (see the tool’s website). 
  2. Aerosols dynamics
    We studied the evolution of aerosols over time, and this allows us to adjust climate models and improve weather forecasts. Besides, we measured dust concentrations and, thanks to understanding how haze is related to climate change, we will be able to work to mitigate its effects. Besides, with these data it will be possible to prevent and warn citizens about upcoming events (Collaboration with Aerosols team).
  3. Health of ponds
    Monitor the photosynthetic activity (chlorophyll a concentration) of microalgae in ponds, as an indicator of the ponds’ health. Remote estimates of the concentration of pigments and suspended particulate matter in ponds facilitates the control and follow-up of their ecological status, and of the quality of their water, in terms of the effects that global change may have upon them.
    (Collaboration with the Ponds team).
  4. Nutrition energy of pastures
    Learn more about the amount of carbon stored in the above-ground part of the plants, and the available metabolic energy present in Sierra Nevada, which plays a crucial role in climate regulation and provides ecosystem services to society. Collaboration with the Ecosystem Services team).
  5. Functioning of vegetation
    Define and monitor essential biodiversity variables that describe key aspects of ecosystem functioning and that are relevant for ecology, conservation, agriculture, climatology, etc., as they allow us to evaluate the effects of global change on several functions and services of ecosystems.
  6. Forest Management
    Find out how the way a forest is managed after a fire influences snow dynamics and natural regeneration; particularly, snow builds up more and melts less if no intervention is done on burnt trees after a forest fire, which has a positive influence on the regeneration of vegetation. (Collaboration with the Regeneration After Fire team).
  7. Distribution of vegetation
    Develop high-accuracy mapping of juniper and savin juniper in high mountain areas, and learn more about their evolution over time, which enables us to relate the changes in their growth and distribution to the effects of climate change and to their historical uses. (Collaboration with the Artificial Intelligence team).
  8. Mapping land uses
    Automatic mapping of changes in land use and land cover, which helps update maps fast and contributes to an efficient territorial planning. Besides, it allows for climate and hydrology modelling, among others. (Collaboration with the Artificial Intelligence team).
  1. MonitoEO
    We developed a tracking system for key aspects in the functioning of ecosystems, and this allows us to detect trends, abrupt changes and disturbances in a way that is fast, reliable, and applicable to any region. Several variables are involved, including how long the snow cover remains, the vegetation greenness, or water and heat stress (see the tool’s website). 
  2. Aerosols dynamics
    We studied the evolution of aerosols over time, and this allows us to adjust climate models and improve weather forecasts. Besides, we measured dust concentrations and, thanks to understanding how haze is related to climate change, we will be able to work to mitigate its effects. Besides, with these data it will be possible to prevent and warn citizens about upcoming events (Collaboration with Aerosols team).
  3. Health of ponds
    Monitor the photosynthetic activity (chlorophyll a concentration) of microalgae in ponds, as an indicator of the ponds’ health. Remote estimates of the concentration of pigments and suspended particulate matter in ponds facilitates the control and follow-up of their ecological status, and of the quality of their water, in terms of the effects that global change may have upon them.
    (Collaboration with the Ponds team).
  4. Nutrition energy of pastures
    Learn more about the amount of carbon stored in the above-ground part of the plants, and the available metabolic energy present in Sierra Nevada, which plays a crucial role in climate regulation and provides ecosystem services to society. Collaboration with the Ecosystem Services team).
  5. Functioning of vegetation
    Define and monitor essential biodiversity variables that describe key aspects of ecosystem functioning and that are relevant for ecology, conservation, agriculture, climatology, etc., as they allow us to evaluate the effects of global change on several functions and services of ecosystems.
  6. Forest Management
    Find out how the way a forest is managed after a fire influences snow dynamics and natural regeneration; particularly, snow builds up more and melts less if no intervention is done on burnt trees after a forest fire, which has a positive influence on the regeneration of vegetation. (Collaboration with the Regeneration After Fire team).
  7. Distribution of vegetation
    Develop high-accuracy mapping of juniper and savin juniper in high mountain areas, and learn more about their evolution over time, which enables us to relate the changes in their growth and distribution to the effects of climate change and to their historical uses. (Collaboration with the Artificial Intelligence team).
  8. Mapping land uses
    Automatic mapping of changes in land use and land cover, which helps update maps fast and contributes to an efficient territorial planning. Besides, it allows for climate and hydrology modelling, among others. (Collaboration with the Artificial Intelligence team).

Data generated by the team

Learn more about the data we are currently generating
  • Estimation of photosynthetic pigments in high-mountain lakes.
  • Pasture production model.
  • Ecosystem Functional Attributes,Types and Diversity.
  • Post-fire legacies management and snow cover.
  • Automated mapping of high-mountain shrubs
    (Juniperus).
  • LULC abundance estimation of Andalucia (satellite RGB imagery) Read article
  • TimeSpec4LULC: A Smart-Global Dataset of Multi-Spectral Time Series of MODIS Terra-Aqua from 2000 to 2021 for Training Machine Learning models to perform LULC Mapping. Read article
  • Sentinel2GlobalLULC: A dataset of Sentinel-2 georeferenced RGB imagery acquired between June 2015 and October 2020 annotated for global land use/land cover mapping with deep learning. Read article
  • Andalusia-MSMTU: LULC mapping of Andalusia via spectral unmixing (time series). Read article